Address
Ballymahon Road, Kenagh, Co Longford, N39DE20
Work Hours
Monday to Friday: 9AM - 5PM

In an increasingly data-driven world, businesses in Ireland are recognizing the value of leveraging data visualisation tools to gain actionable insights. Data visualisation is no longer just a “nice-to-have” feature but a critical business function. By presenting complex datasets in a clear and visually appealing manner, organisations can make informed decisions quickly and effectively. This article explores the importance of data visualisation and its potential to transform Irish businesses.
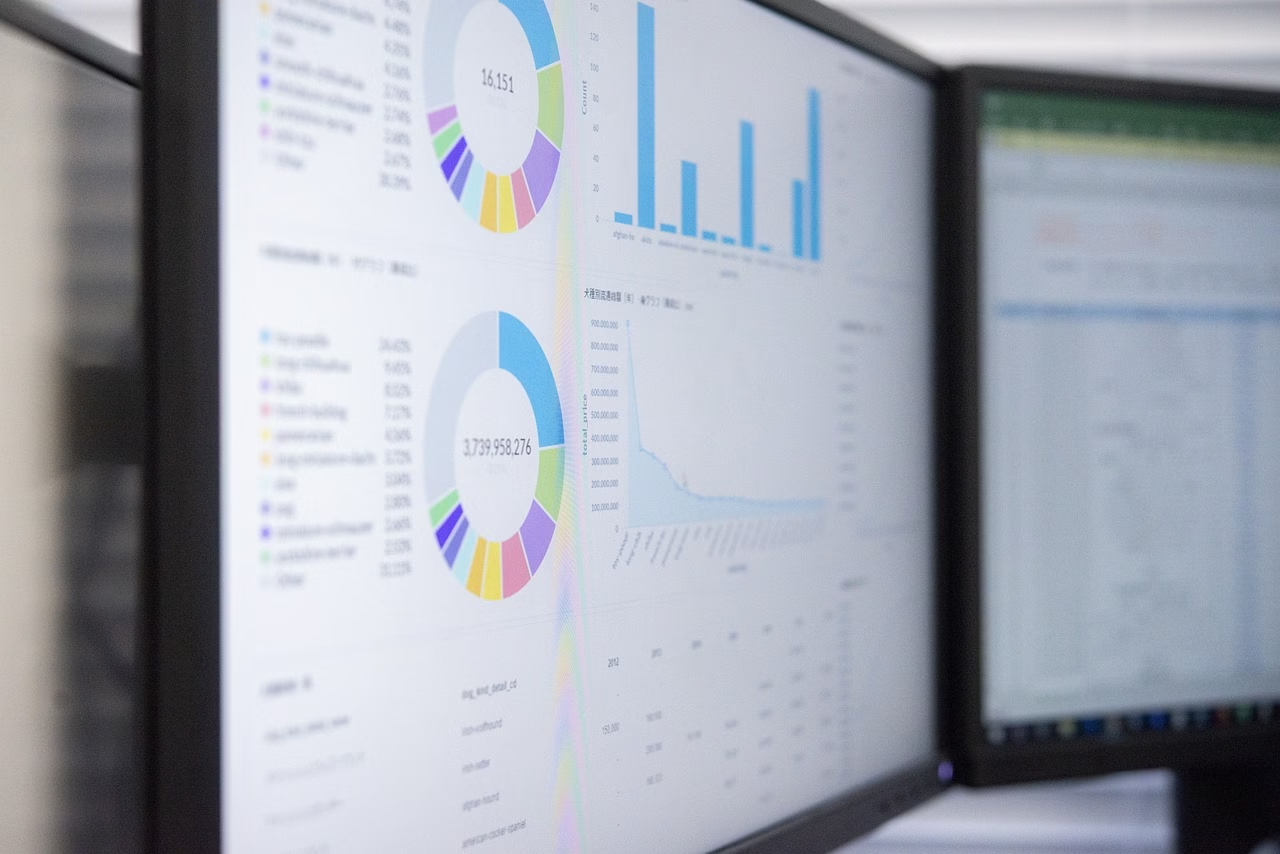
Data visualization is the process of representing data through visual elements such as charts, graphs, and dashboards. Tools like Power BI, Tableau, and Excel are commonly used to turn raw data into digestible insights. By combining aesthetics with analytics, visualisation allows decision-makers to grasp trends, correlations, and anomalies that might otherwise remain hidden.

Ireland is home to a diverse range of industries, from tech giants like Google and Apple to SMEs driving local economies. Each generates vast amounts of data daily. Visualisation simplifies this complexity, enabling businesses to focus on strategic decisions rather than struggling with cumbersome data spreadsheets.
Example: A Dublin-based retail company might use data visualisation to track consumer purchasing patterns. With interactive dashboards, they can quickly identify the most popular products, seasonal trends, or underperforming categories.
In Ireland’s competitive business landscape, timely decisions are essential. Visualisation tools allow businesses to interpret real-time data, empowering them to act swiftly. This is especially critical for industries like finance, healthcare, and logistics, where delays can have significant consequences.
Case Study: An Irish financial services firm used Power BI to visualise real-time market fluctuations. This helped them predict trends and optimise investment portfolios, saving clients thousands of euros annually.
Data visualization reduces the time spent interpreting reports. Instead of manually sifting through rows of data, teams can access intuitive dashboards that display key performance indicators (KPIs). This boosts productivity and allows employees to focus on core business activities.
Stat: According to a report by the International Data Corporation (IDC), businesses that adopt data visualisation tools experience a 30% increase in efficiency. Irish companies can expect similar results by integrating these tools into their workflows.
In Ireland, where small businesses often operate with lean teams, collaboration is key. Visualisation tools make it easier for departments to share insights, align strategies, and work towards common goals. For example, marketing teams can share campaign performance dashboards with sales teams to optimise lead conversion strategies.
Ireland has strict regulatory frameworks for data management, including GDPR. Visualisation tools help businesses present data transparently to stakeholders, ensuring compliance while maintaining trust. For example, healthcare providers can use visualisation to report patient data trends without compromising confidentiality.
Many Irish SMEs feel that data analytics is a luxury reserved for large corporations. However, affordable tools like Power BI offer scalable solutions tailored to the unique needs of small businesses. Whether it’s monitoring cash flow or analysing customer behaviour, SMEs can benefit immensely.
With sustainability becoming a top priority, Irish businesses are exploring ways to reduce their carbon footprint. Visualisation tools can track energy consumption, optimise supply chains, and ensure compliance with environmental regulations. This aligns with Ireland’s goal of achieving carbon neutrality by 2050.
As digital transformation accelerates, the demand for visualisation tools will continue to grow. Irish businesses that invest in these technologies now will be better positioned to adapt to future challenges. From AI-driven dashboards to real-time analytics, the potential is limitless.
Data visualisation bridges the gap between raw data and actionable insights. For Irish businesses, it’s not just about staying competitive but thriving in a digital-first world.
In a dynamic economy like Ireland’s, businesses must harness the power of data visualisation to stay ahead. By turning raw data into meaningful insights, visualisation tools enable companies to make smarter decisions, boost productivity, and achieve sustainable growth. Whether you’re a tech startup in Cork or a family-owned business in Galway, the message is clear: embracing data visualisation is no longer optional—it’s essential.
At Insight Partners, we specialize in helping small and medium-sized businesses across Ireland get started with data visualisation. From integrating tools like Power BI to developing tailored dashboards and actionable reports, our team ensures that you unlock the full potential of your data. Let us guide you through the process step by step, empowering you with the insights needed to drive your business forward.
Ready to turn your data into results? Contact us today to explore how our data visualisation solutions can transform your business!
References
2. Central Statistics Office (CSO) Ireland